> For the complete documentation index, see [llms.txt](https://docs.onelens.cloud/llms.txt). Markdown versions of documentation pages are available by appending `.md` to page URLs; this page is available as [Markdown](https://docs.onelens.cloud/observe-visibility-and-insights/service-cost-monitoring/data-transfer-cost-reports.md).
# Data Transfer Cost Reports
Managing cloud infrastructure often means overlooking data transfer costs. With OneLens, you can pinpoint these hidden expenses - whether from public traffic, inter-region transfers, or cross-AZ communication. This section helps you track where your data moves, what it costs, and how to control it.
## Access Data Transfer Cost Reports
1. Log into OneLens.
2. Navigate to the **Data Transfer Cost** from the main dashboard.
Here is how the dashboard will look like:

#### Number References
1. [View Option](#view)
2. [Date Range](#date-range)
3. [Granularity Level](#granularity-level)
4. [Cost Representation Type](#cost-representation-type)
5. [Filters](#applying-filters)
6. [Data Transfer Cost Trends](#data-transfer-cost-trend)
7. [Group By Option](#grouping-by-option)
8. [Visualization Type](#visualization-type)
1. Bar Chart
2. Filled Area Chart
3. Table Format
[**Deep Data Transfer Cost View**](#deep-data-transfer-cost-view)
9. [By Region](#by-region)
10. [By Higher Data Transfer Cost Contributors](#by-highest-data-transfer-cost-contributors)
11. [By Resources](#by-resources)
12. [By Operations](#by-operations)
## Understanding Data Transfer Cost
### Report View Configuration
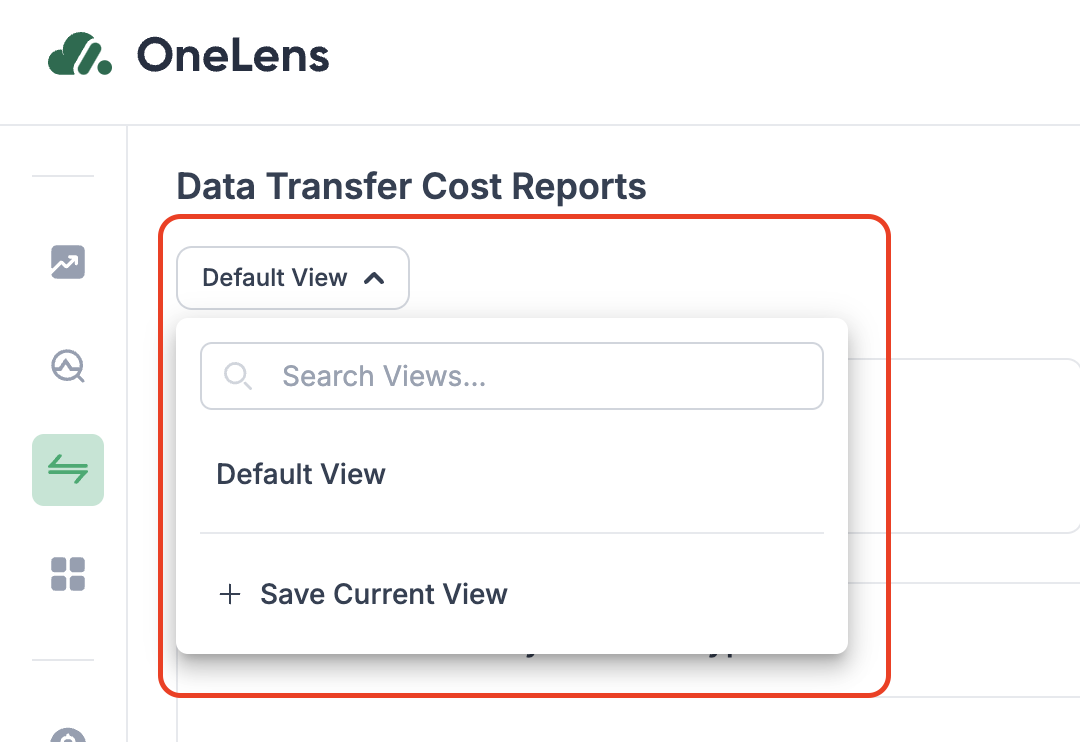
#### Report View
Start with the **default view** for a quick overview.
#### Date Range
* **Predefined Range:** Quickly access relevant cost data by selecting a range such as “**Last 2 Weeks**” or “**Month-to-Date**”.
* **Custom Range**: If you need to analyze costs over a specific period, define a custom date range to focus on the exact time frame.
#### *Granularity Level*
You can aggregate cost data in three different ways, depending on the granularity you need for your analysis:
* **Daily**
* **Weekly**
* **Monthly**
#### *Cost Representation Type*
You can choose the most relevant Cost Representation Type to gain the insights you need:
* **Unblended Cost** – See the raw cost before any discounts.
* **Net Unblended Cost** – Get the final bill after AWS discounts are applied.
* **Blended Cost** – Useful when managing accounts with shared resources.
* **Amortized Cost** – See long-term costs distributed across the commitment period.
* **Net Amortized Cost** – The clearest view of your true, discounted long-term spending.
#### Applying filters
Filters help refine cost reports by focusing on specific data points.
Here is how you apply filters:
1. Navigate to the `Filters` section at top left corner.
2. Select multiple conditions to filter data using an AND condition.
3. Add rules by selecting:
1. **Field**: Choose a cost attribute (e.g., Service, Account, Usage Type, Cost Center).
2. **Operator**: Available operators for setting filter conditions include **In** or **Not In**.
3. **Value**: Enter the specific data point to filter (e.g., EC2, us-east-1, >$1000).
4. Click `Apply` to filter cost data and focus on relevant insights.
{% hint style="info" %}
## **Use case**
A cloud engineer wants to analyze storage costs for a specific AWS region and service to track data transfer expenses more effectively.
### **Solution:**
The engineer applies the following filters:
* Service: **Amazon S3**
* Region: **us-east-1**
The Data Transfer Cost Report then displays cost data specifically for Amazon S3 in the US-east-1 region, helping the engineer track and investigate any rising data transfer costs.
{% endhint %}
{% hint style="success" %}
## **Save Your Configured View**
After customizing your view, save it for easy access later. [Click here to learn how to save your view](/observe-visibility-and-insights/cost-reporting/cost-atlas/saved-views.md#how-to-save-a-view).
{% endhint %}
### Key Metrics
Right at the top, you’ll find a quick snapshot of where things stand.
#### **Total Cost**
* This shows your full cloud spend for the selected period.
#### **Total Data Transfer Cost (Data Transfer Cost)**
* Focus in on how much of that spend is due to data transfer.
#### **Data Transfer Cost Delta**
* See whether your data transfer cost is climbing or falling compared to the previous time window.

### Data Transfer Cost by Transfer Type
Understand the nature of your data movement and where the money goes.
#### **Public Transfers**
* Track internet-bound traffic and associated costs.
#### **Inter-AZ Transfers**
* Measure internal transfers between availability zones that still incur charges.
#### **Inter-Region Transfers**
* Identify cross-region communication that often spikes your bill.
{% hint style="success" %}
## Tip
Click on any transfer type name to hide or show its data in the visualization.
{% endhint %}

### Data Transfer Cost Trend
Explore how your data transfer cost behaves over time, with flexible options for grouping and visualization.
{% hint style="success" %}
## **Hover Chart for Detailed Insights**
While exploring charts, **hover over any area** to instantly view detailed information for that segment.
{% endhint %}
#### **Grouping By Option**
You can **group by** using the following dimensions:
1. Account
2. API Operation
3. Availability Zone
4. Billing Entity
5. Charge Type
6. Database Engine
7. Legal Entity
8. Platform
9. Purchase Option
10. Region
11. Resource
12. Service
13. Tag
14. Tenancy
15. Transfer Type
16. Usage Type
#### **Visualization Type**
**Bar Chart**
* Use this view to compare data transfer costs across categories—such as accounts, services, or regions—side by side.

**Stacked Filled Chart**
* Ideal for identifying cumulative trends over time, this chart shows how different components contribute to the total cost.

**Table Format**
* Provides a detailed, exportable view of your data, ideal for deep analysis or sharing with stakeholders.
### Deep Data Transfer Cost View
Once you've reviewed the trends and key metrics, you can drill down into the details to uncover exactly where your data transfer costs are coming from.
#### **By Region**
Get a complete picture of how data transfer costs vary across AWS regions. There are two main sections available, plus the **option to toggle a detailed table format**:
* **Highest Spending Regions**
* View the regions with the highest data transfer costs, making it easy to identify key cost drivers.
* **Data Transfer Cost Overview**
* Get a comprehensive look at the overall distribution of data transfer costs across all AWS regions.
* **Table View**
* Switch to a table format for a more granular breakdown of the data. The table can be exported for offline analysis or reporting.
!\[A screenshot of a computer
AI-generated content may be incorrect.]\(/files/ZCksxe2AdbqGJOqZC6dC)
#### **By Highest Data Transfer Cost Contributors**
Identify the top contributors to your data transfer costs. This view is broken down into three key sections, each with **an option to toggle the table format** for a detailed breakdown:
* **By Service**
* View the top services contributing to your data transfer costs.
* **By Account**
* See which accounts are driving the most data transfer costs in your environment.
* **By Cost Center**
* Break down costs by your internal cost center structure. You must select one of the following **granularities to view the breakdown: ****Account, Environment, Root, or Project**.

#### **By Resources**
View the resources contributing to your data transfer costs, focusing on the top 10, with these key features:
* **Data Size in GB or TB**
* Toggle between GB or TB to see the data transfer size in the format that suits your needs.
* **Table View**
* Switch to a table format to access a comprehensive list of all resources contributing to data transfer costs. This view is exportable for further analysis.

#### **By Operations**
You can analyze data transfer costs based on AWS operations, focusing on the top 10. Key features include:
* **Data Size in GB or TB**
* Toggle between GB or TB to view the data transfer size in your preferred unit for better scalability insights.
* **Table View**
* Switch to a table format to view all operations contributing to data transfer costs. This option is exportable for further analysis.

## Export Reports
You can export cost reports for offline analysis or to share with stakeholders.\
The **Export** option is available at the **top left corner of every table view**.
You can choose from:
* **CSV** – Ideal for detailed data analysis and manipulation.
* **Excel** – Provides a structured spreadsheet version of the report.
#### Sample Preview
Here is the preview of a sample exported report:
---
# Agent Instructions
This documentation is published with GitBook. GitBook is the documentation platform designed so that both humans and AI agents can read, navigate, and reason over technical content effectively. Learn more at gitbook.com.
## Querying This Documentation
If you need additional information that is not directly available in this page, you can query the documentation dynamically by asking a question.
Perform an HTTP GET request on the current page URL with the `ask` query parameter, and the optional `goal` query parameter:
```
GET https://docs.onelens.cloud/observe-visibility-and-insights/service-cost-monitoring/data-transfer-cost-reports.md?ask=&goal=
```
`ask` is the immediate question: it should be specific, self-contained, and written in natural language.
`goal` is optional and describes the broader end goal you are ultimately trying to accomplish on behalf of the user. GitBook uses it to tailor the answer towards what is most useful for that goal.
The response will contain a direct answer to the question and relevant excerpts and sources from the documentation.
Use this mechanism when the answer is not explicitly present in the current page, you need clarification or additional context, or you want to retrieve related documentation sections.

 #### Date Range
* **Predefined Range:** Quickly access relevant cost data by selecting a range such as “**Last 2 Weeks**” or “**Month-to-Date**”.
* **Custom Range**: If you need to analyze costs over a specific period, define a custom date range to focus on the exact time frame.
#### Date Range
* **Predefined Range:** Quickly access relevant cost data by selecting a range such as “**Last 2 Weeks**” or “**Month-to-Date**”.
* **Custom Range**: If you need to analyze costs over a specific period, define a custom date range to focus on the exact time frame.


